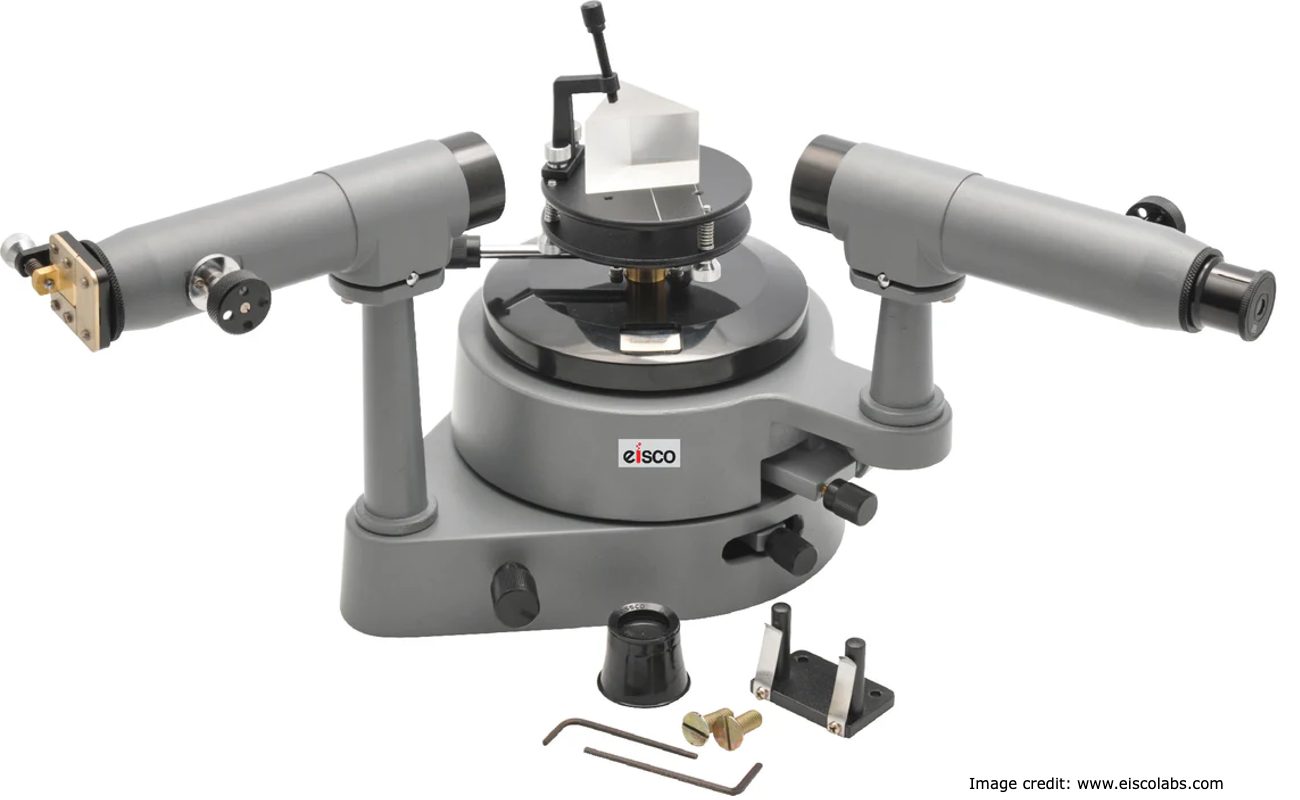
Spectrometry; What is it, types, how it works, where and how to use in formulation optimization
Spectrometry is a powerful analytical tool used to measure the interaction of light with matter. It involves the use of a spectrometer to measure the intensity of light at different wavelengths, and the resulting data can provide valuable information for formulation optimization. However, interpreting spectrometry data can be challenging, especially for beginners. In this article, we will provide a comprehensive guide on how to interpret spectrometry data for formulation optimization.
Understanding the Basics of Spectrometry
Before we dive into the interpretation of spectrometry data, let's first understand the basics of spectrometry. Spectrometry is based on the principle that different molecules absorb and transmit light differently at different wavelengths. When light passes through a sample, some of the light is absorbed, and the rest is transmitted. The absorbed light energy causes the electrons in the molecules to move from a lower energy state to a higher energy state. The amount of light absorbed depends on the concentration of the sample and the wavelength of light used.
Spectrometry can be used to measure various types of samples, including solids, liquids, and gases. However, the most common type of spectrometry is UV-Vis spectrometry, which measures the absorption of light in the ultraviolet and visible regions of the electromagnetic spectrum.
Interpreting Spectrometry Data for Formulation Optimization
The following are the steps to interpret spectrometry data for formulation optimization:
Step 1: Collect Spectrometry Data
The first step is to collect spectrometry data for the sample of interest. This can be done using a spectrophotometer, which measures the amount of light absorbed by the sample at different wavelengths. The spectrophotometer generates a spectrum, which is a plot of absorbance versus wavelength. The spectrum can be used to identify the functional groups in the sample and to determine the concentration of the sample.
Step 2: Identify Functional Groups
The second step is to identify the functional groups in the sample. This can be done by analyzing the peaks in the spectrum. Each peak corresponds to a specific functional group in the sample. For example, a peak at 1710 cm-1 indicates the presence of a carbonyl group, while a peak at 3400 cm-1 indicates the presence of a hydroxyl group.
Step 3: Determine the Concentration
The third step is to determine the concentration of the sample. This can be done by measuring the absorbance of the sample at a specific wavelength and comparing it to a standard curve. The standard curve is generated using a known concentration of the sample and measuring the absorbance at different wavelengths.
Step 4: Optimize the Formulation
The final step is to use the spectrometry data to optimize the formulation. This can be done by adjusting the concentration of the sample and the type of functional groups in the sample. The goal is to achieve the desired properties of the formulation, such as stability, solubility, and bioavailability.
Conclusion
In conclusion, spectrometry is a powerful analytical tool that can provide valuable information for formulation optimization. By following the steps outlined in this article, you can interpret spectrometry data and use it to optimize your formulation. Spectrometry is a valuable tool for the pharmaceutical industry and other fields that require precise control over the properties of a sample.

