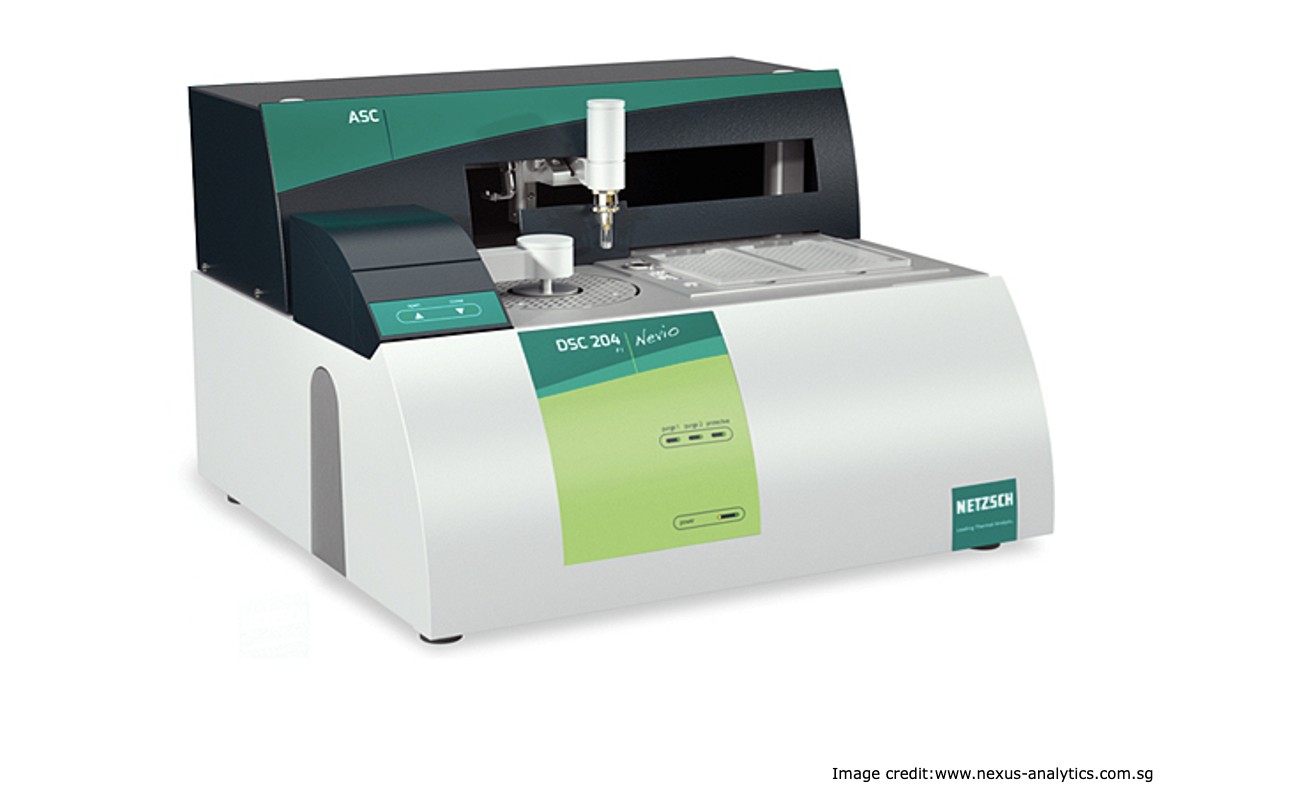
Differential Scanning Calorimetry (DSC); What is it, and how interpret DSC data for formulation optimization
Differential Scanning Calorimetry (DSC) is a widely used analytical technique for studying the thermal behavior of materials. DSC measures the heat flow into or out of a sample as a function of temperature or time while the sample is subjected to a controlled thermal program. The analysis of DSC data can provide valuable information for the formulation optimization of pharmaceuticals, polymers, foods, and other materials.
DSC data interpretation involves the analysis of the thermograms obtained from the experiment. A thermogram is a plot of heat flow as a function of temperature or time. The analysis of the thermogram can provide information about the thermal transitions and the thermal stability of the sample. The following is a step-by-step guide to interpreting DSC data for formulation optimization.
Step 1: Identify the Baseline
The baseline is the heat flow curve that would be observed if the sample had no thermal transitions. It represents the heat flow from the instrument and any other sources that are not related to the sample. The baseline is determined by running a blank or reference experiment, where an empty pan is run under the same conditions as the sample. The baseline should be subtracted from the sample data to obtain the correct heat flow values.
Step 2: Identify the Thermal Transitions
The thermal transitions are the changes in the heat flow observed in the thermogram. These transitions correspond to the phase changes or chemical reactions occurring in the sample. The most common thermal transitions observed in DSC experiments are melting, crystallization, glass transition, and decomposition.
Melting: This transition corresponds to the change from a solid to a liquid state. It is observed as an endothermic peak, where heat is absorbed by the sample. The onset temperature, peak temperature, and enthalpy of melting can be determined from the thermogram.
Crystallization: This transition corresponds to the change from a liquid to a solid state. It is observed as an exothermic peak, where heat is released by the sample. The onset temperature, peak temperature, and enthalpy of crystallization can be determined from the thermogram.
Glass Transition: This transition corresponds to the change from a glassy to a rubbery state. It is observed as a broad endothermic peak, where heat is absorbed by the sample. The onset temperature, midpoint temperature, and enthalpy of glass transition can be determined from the thermogram.
Decomposition: This transition corresponds to the chemical degradation of the sample. It is observed as an exothermic peak, where heat is released by the sample. The onset temperature and peak temperature can be determined from the thermogram.
Step 3: Determine the Thermal Stability
The thermal stability of the sample can be determined from the DSC data. The thermal stability refers to the temperature range over which the sample is stable, and it can be determined by analyzing the onset temperature and the end temperature of the thermal transitions. A sample with a narrow thermal stability range is less stable than a sample with a broad thermal stability range.
Step 4: Evaluate the Formulation
The DSC data can be used to evaluate the formulation of the sample. The formulation refers to the composition of the sample, including the type and amount of excipients used. The DSC data can be used to optimize the formulation by identifying the optimal composition that provides the desired thermal stability, melting point, and other properties.
In conclusion, DSC is a powerful tool for studying the thermal behavior of materials. The analysis of DSC data can provide valuable information for the formulation optimization of pharmaceuticals, polymers, foods, and other materials. By following the above steps, the DSC data can be effectively interpreted to optimize the formulation and improve the quality of the final product.

