
FTIR (Fourier transform infrared); What is it and how to interpret FTIR data for formulation optimization
Fourier transform infrared (FTIR) spectroscopy is a powerful analytical technique used to identify and quantify various chemical species in a sample. FTIR spectroscopy measures the absorption of infrared radiation by a sample, which is related to the molecular vibrations of the sample's constituent molecules. FTIR spectra provide a wealth of information about the chemical composition, structure, and bonding of the sample, which can be used to optimize formulations in various industries, including pharmaceuticals, cosmetics, and food.
Interpretation of FTIR spectra for formulation optimization involves several steps, including data acquisition, data preprocessing, spectral analysis, and interpretation. Here we outline these steps and discuss some common strategies for using FTIR data to optimize formulations.
Data acquisition and preprocessing
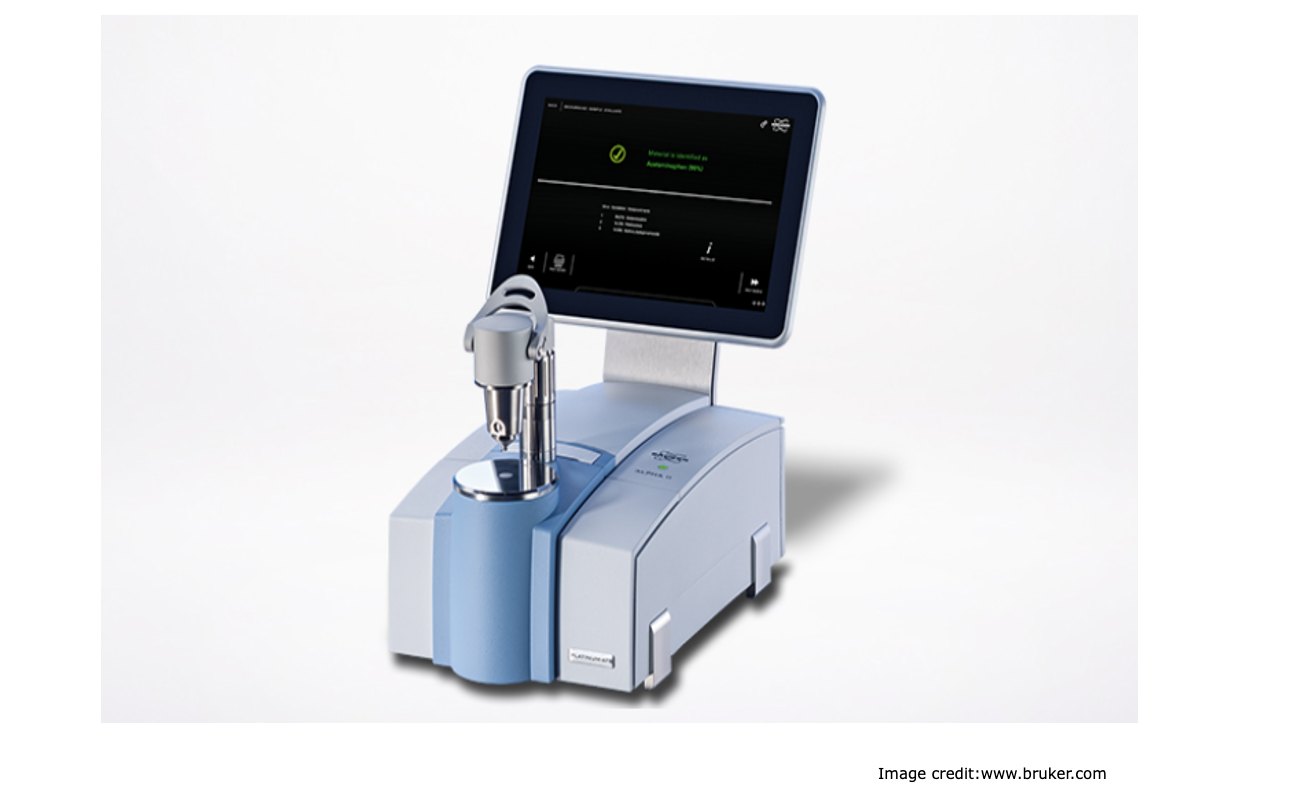
FTIR spectra are typically acquired using a spectrophotometer, which generates a beam of infrared radiation that is directed through the sample. The transmitted radiation is detected by a detector and converted into a spectrum, which represents the absorption of radiation as a function of the wavenumber (frequency) of the radiation. The resulting spectrum contains a series of peaks and troughs, which correspond to the vibrations of the sample's constituent molecules.
Before interpreting FTIR spectra, it is essential to preprocess the data to remove any noise and artifacts that may affect the accuracy and reliability of the analysis. Preprocessing techniques may include baseline correction, normalization, and smoothing. Baseline correction removes any background noise or drift in the spectrum, while normalization adjusts the intensity of the spectrum to a standard value. Smoothing removes any high-frequency noise that may obscure the spectral features of interest.
Spectral analysis
The spectral analysis of FTIR data involves the identification and characterization of the spectral features that correspond to the chemical species in the sample. This can be achieved using various spectral analysis techniques, including peak picking, peak fitting, and multivariate analysis.
Peak picking involves identifying the positions of the peaks in the spectrum and assigning them to specific vibrational modes of the sample's constituent molecules. This is often done manually or using software that automatically identifies peaks based on predefined criteria such as peak height, width, and shape.
Peak fitting involves fitting mathematical functions to the peaks in the spectrum to obtain information about their shape, width, and intensity. This allows for a more accurate determination of the positions and properties of the peaks, which can be used to identify the chemical species in the sample.
Multivariate analysis involves the use of statistical methods to analyze the spectral data and identify patterns or correlations between the spectral features and the sample properties. This can be used to identify the chemical species that contribute to specific spectral features and to optimize the formulation of the sample.
Interpretation
Once the spectral features have been identified and characterized, the interpretation of the FTIR data can begin. This involves relating the spectral features to the chemical composition, structure, and bonding of the sample, which can provide insights into the formulation of the sample.
For example, the presence of specific functional groups in the FTIR spectrum can indicate the presence of specific chemical species in the sample, such as polymers or surfactants. The intensity of specific peaks can also indicate the concentration of these chemical species, which can be used to optimize the formulation of the sample.
In addition, changes in the spectral features over time or with different formulations can provide insights into the stability and efficacy of the sample. For example, changes in the intensity of specific peaks may indicate chemical degradation or changes in the formulation that affect the stability or efficacy of the sample.
Conclusion
FTIR spectroscopy is a powerful analytical technique that can provide valuable information about the chemical composition, structure, and bonding of a sample. Interpretation of FTIR spectra for formulation optimization involves data acquisition, preprocessing, spectral analysis, and interpretation. By identifying the spectral features that correspond to specific chemical species, FTIR data can be used to optimize the formulations.